Users have a provision to analyse the survey data in a graphical format. To analyse a survey report, go to the list of surveys and select one to analyse. Click on the Analyse option.
Once users select the analyse option, they will be directed to the Dashboard page of the reports or the Insights page.
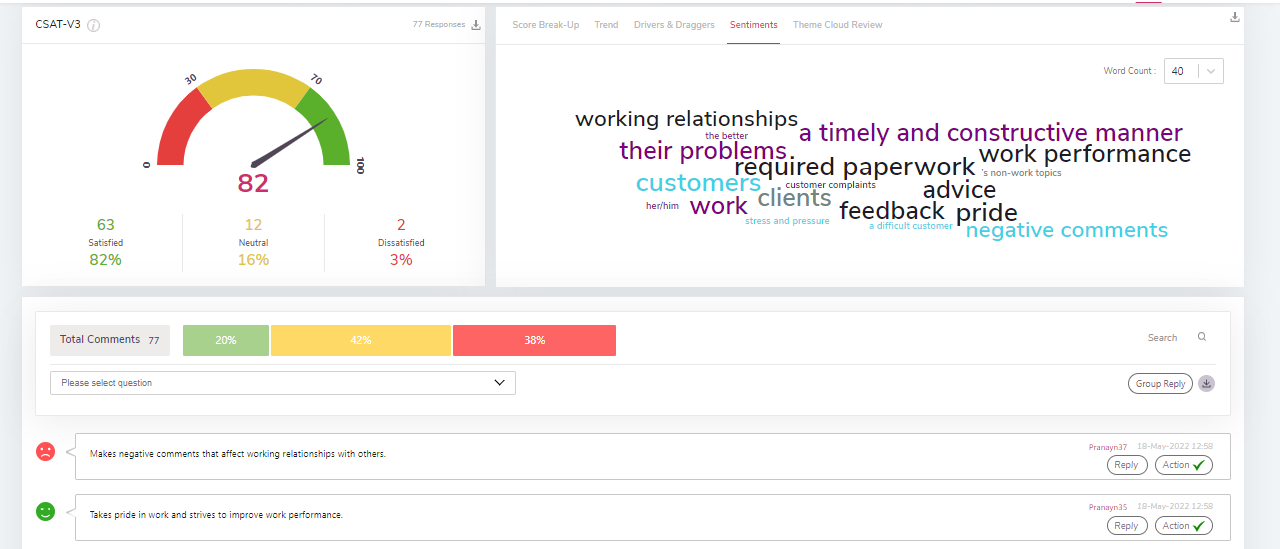
Users can verify overall responses in terms of total respondents, overall score, total satisfied, dissatisfied, and neutral scores in the count and as well in percentage as shown in the image below. To know more about the calculation logic of the CSAT, users can click on the ‘i’ icon given to the right side of the CSAT section.
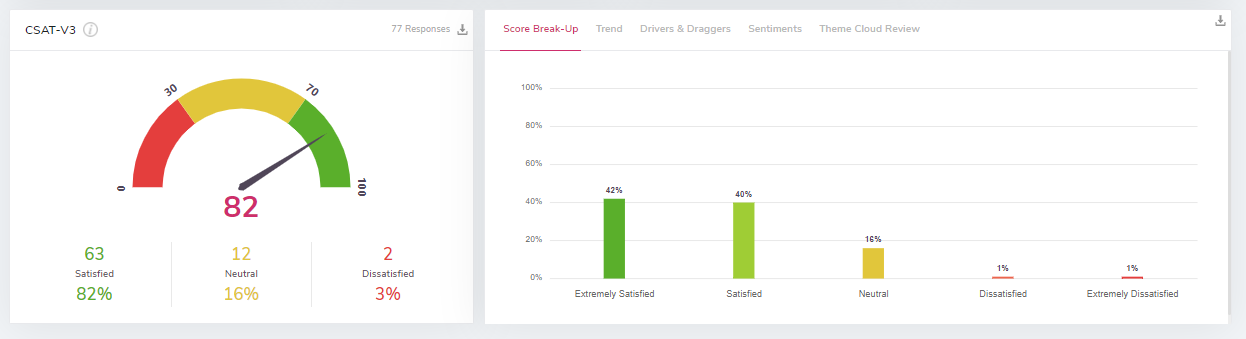
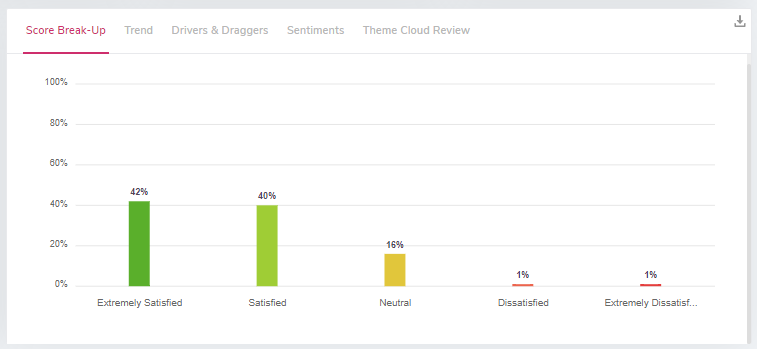
Score Break-up:
The Score Break-up bar graph shows the number of respondents in a categorised format according to their responses.
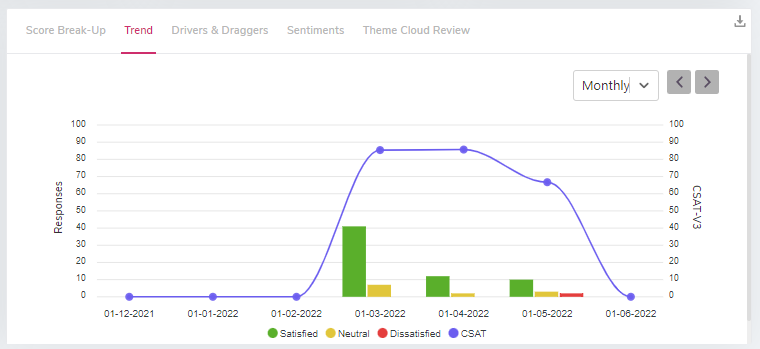
Trend:
The trend graph allows users to check the report of participant responses like satisfied, neutral, or dissatisfied Trend-wise. Users can change the timeline from the dropdown as per their requirements. The score and the date also hover once the cursor is on a graph.
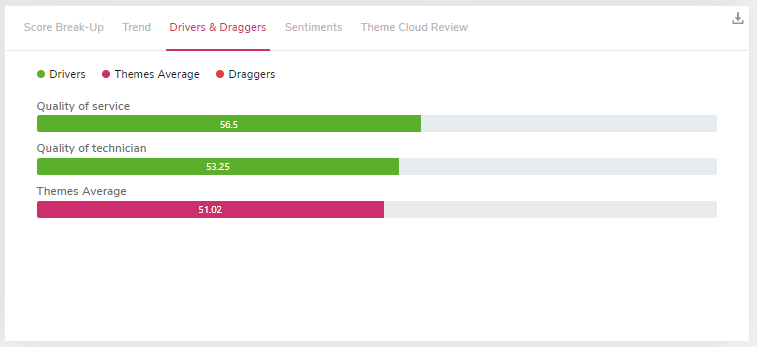
Drivers and Draggers:
Drivers and Draggers allow users to verify the score’s theme-wise.
Note: If the CSAT question has a child question, then the options chosen by the participants for the child question will be displayed. If the Child Question for the CSAT is not present then the score for the theme will appear.
Sentiments:
The Sentiments section shows the total comments given by the respondents in the survey. Users can also change the word count from the dropdown. As per the selected count, the number of comments will display.
The comments are divided into three categories Positive, Neutral, and Negative. Users can verify the comments by clicking on the desired sentiment (positive, neutral, negative).
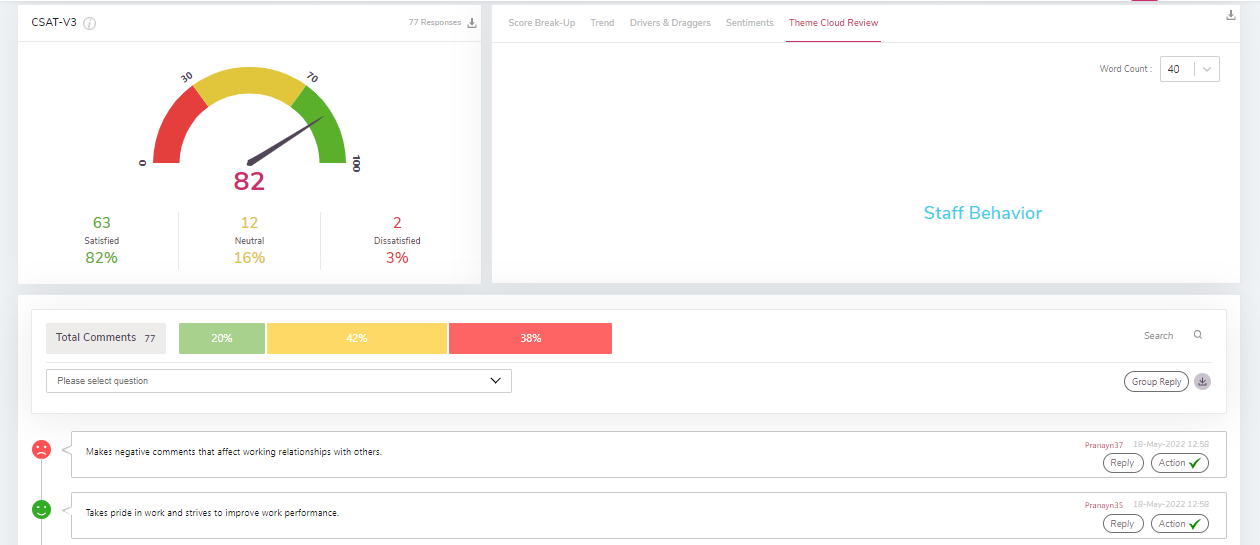
Theme cloud Review:
A theme cloud will be generated for the sentiments having the most number of occurrences and based on which positive neutral and negative comments will be displayed.