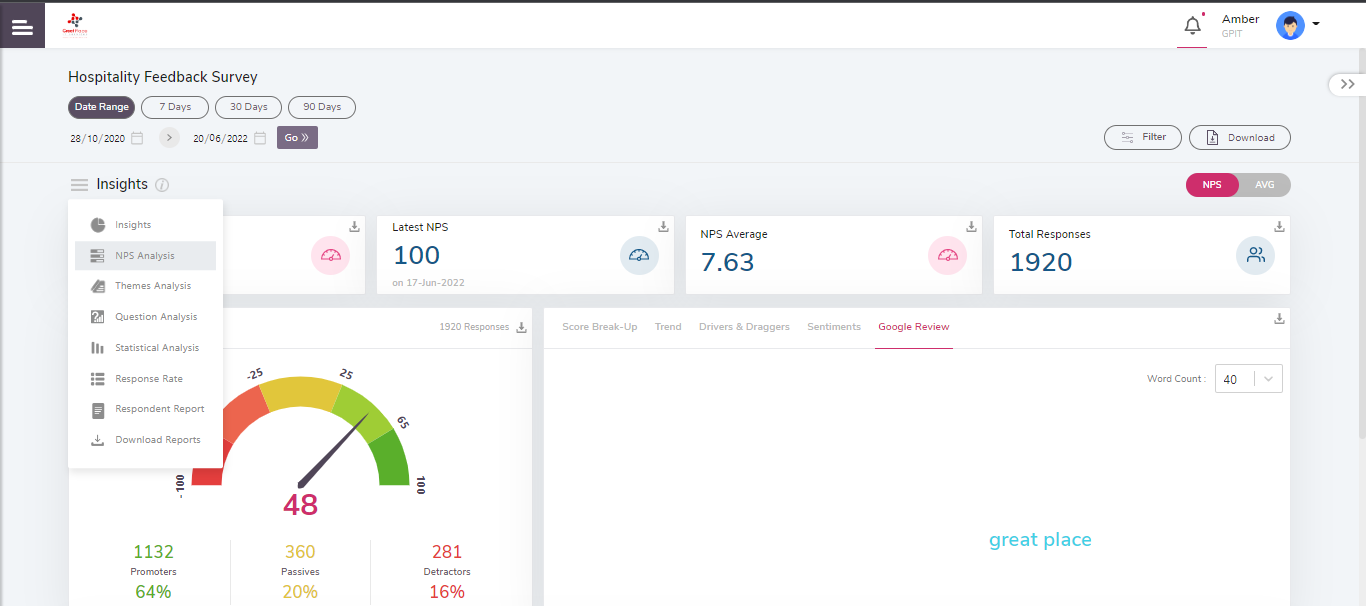
NPS analysis in Reports shows the complete analysis of the NPS survey in a graphical format using different visualizations.
Once the users get directed to the NPS analysis page, they would be expected to select a criterion to visualize the survey results.
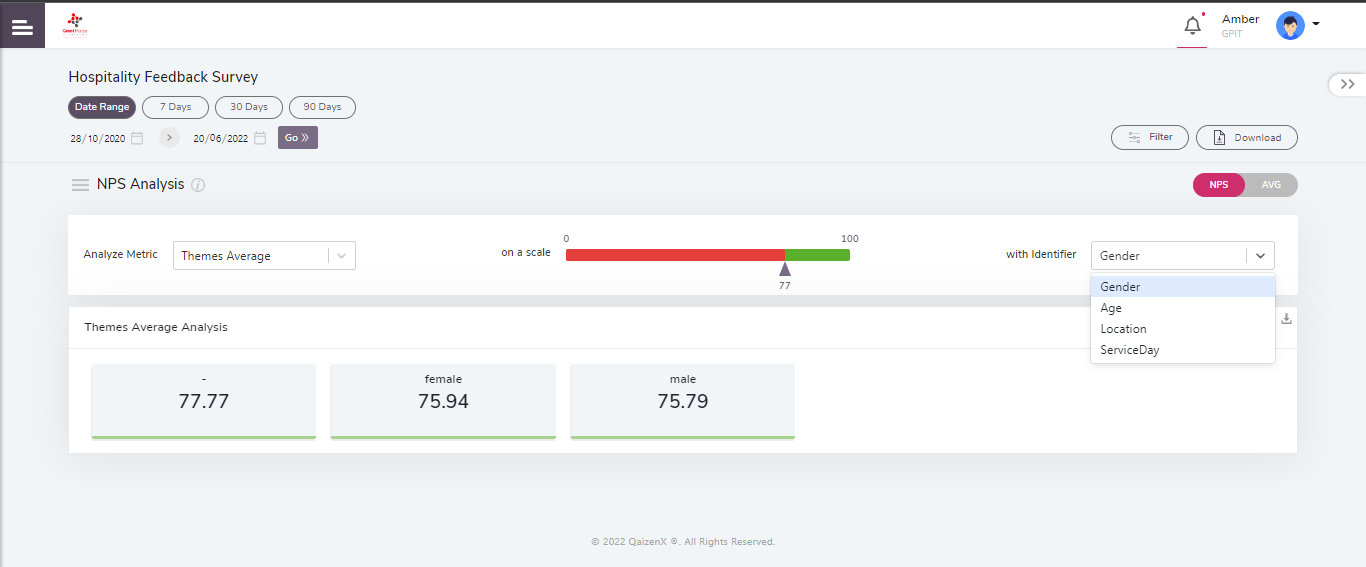
The Analyse Metric allows the user to select a theme or the overall score. The scale pointer acts as a Benchmark. Users can see the results after selecting a Benchmark from the scale pointer. To set the benchmark user should move the arrow right to left as per the requirement. Users are also required to select an identifier from the dropdown. The results will be displayed as per the selected criteria.
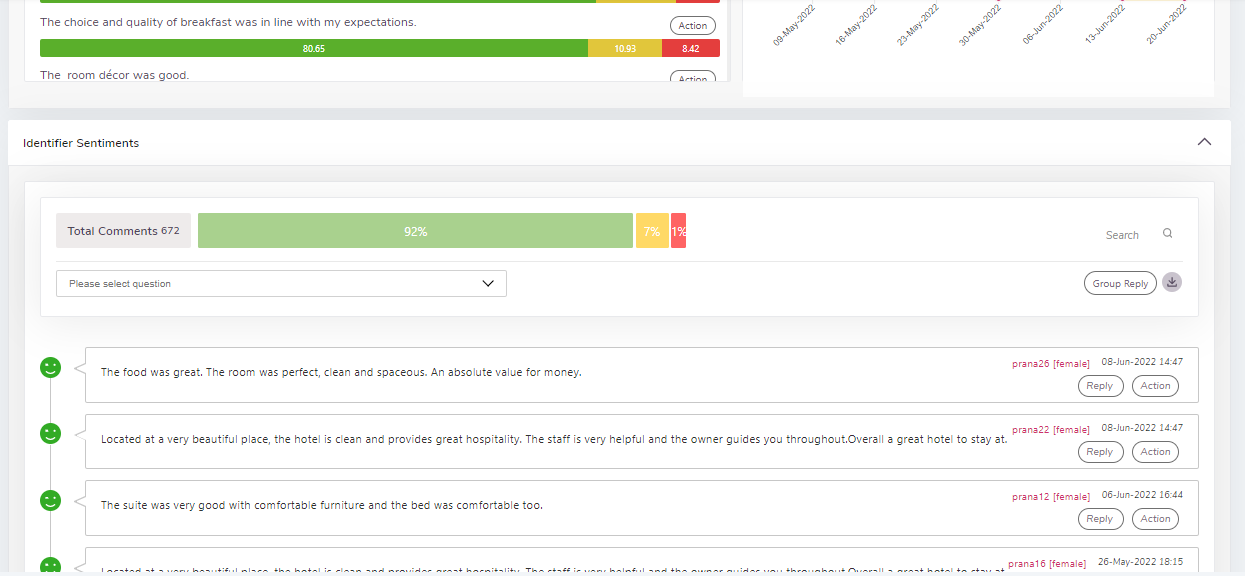
Based on the selections as shown in the Metric – Overall (NPS), identifier – Location, and defined benchmark, result will appear. The underlined red boxes indicate the overall score is less than the benchmark whereas green boxes indicate the overall score is greater than the defined benchmark (positive). All the identifier options show the overall NPS score. When the user selects one option, the sentiments (comments) associated with that option appear below as shown. Identifier sentiments are based on individual identifier options.
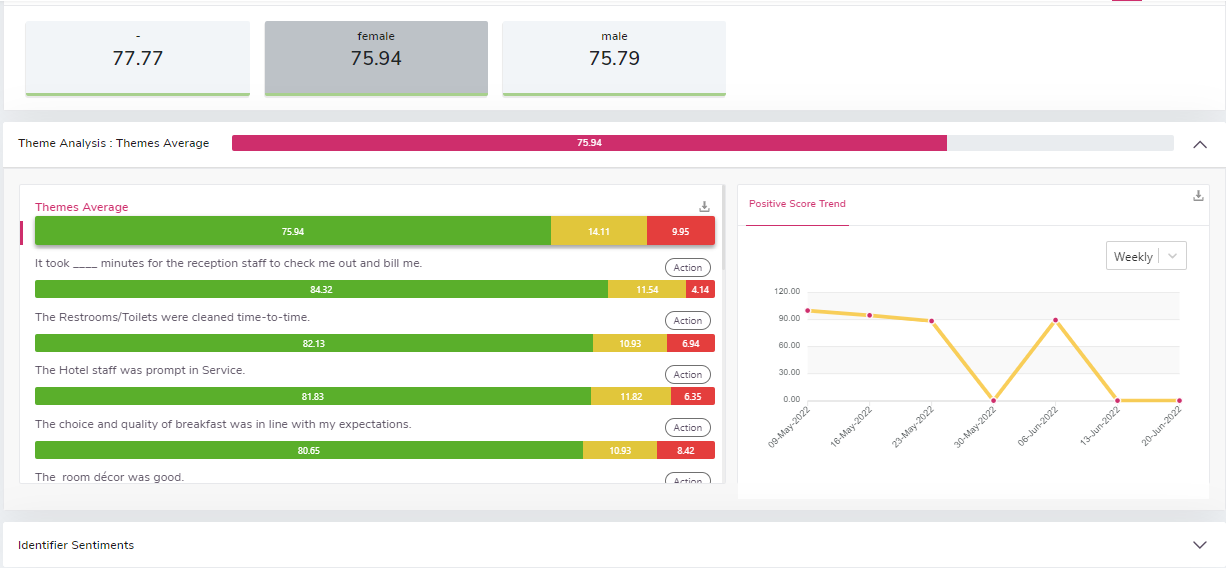
When users select a particular theme, all the questions associated with that theme are displayed using different visualizations for further analysis. The overall analysis of the theme is shown initially followed by all the questions associated with that theme.